LabPlot is a FREE, open source and cross-platform Data Visualization and Analysis software accessible to everyone.
High-quality Data Visualization and Plotting with just a few clicks
Reliable and easy Data Analysis and Statistics, no coding required!
Intuitive and fast Computing with Interactive Notebooks
Effortless Data Extraction from plots and support for Live Data
Smooth Data Import and Export to and from multiple formats
Available for Windows, macOS, Linux and FreeBSD
 Homepage Homepage
 Download Download
Recent Releases
2.12.025 Nov 2024 13:25
major bugfix:
New features:
import .
Download datasets from kaggle.com.
Support MCAP file import.
Show error messages for the serial port in when creating a live data source to notify directly about missing device permissions, etc.
Add warning when importing projects in file import dialog.
Improve error messages for data import.
Preview of data with header.
analysis .
Add possibility to do calculations on curves.
spreadsheet .
Support periodic and random sampling as function: psample(n;x), rsample(x).
Save the properties used to generate random values in the column for later re-use.
Allow to perform the distribution fit to the data directly from the spreadsheet.
worksheet .
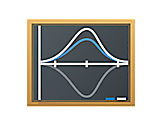
New visualization type "Process Behavior Chart".
More space for plots and less "ink" - no layout spacings, no minor grid lines, not plot borders, no ticks on secondary axes on default.
Allow to provide names for plot ranges for easier lookup and assignemnt in the plot elements.
:
Crash selecting "cell" from function list in function dialog.
Properly draw the border line of the symbol in the legend ().
Show Ticks on inverted axes ( 492475).
Internal:
Use name LabPlot/labplot consistenly (renamed LabPlot2/labplot2).
Switch to Qt6 only.
2.11.110 Jul 2024 04:45
minor bugfix:
:
ODS support.
the initial positioninig of the docks, should be put besides each other and not below.
Don't try to restore the window size when starting for the first time, let the window manager do the initial size.
Don't crash when opening a project which a hidden spreadsheet view.
the background color of the sparklines in the spreadsheet.
2.11.002 Aug 2023 03:15
major bugfix:
New features:
worksheet .
Add possibility to use column labels as axis ticks.
New visualization types:
Lollipop plot.
Q-Q plot.
spreadsheet .
Spreadsheet linking - allow to synchronize number of rows across multiple spreadsheets.
Extended search and replace.
Column statistics spreadsheet - child spreadsheet showing various statistical properties of the parent spreadsheet.
notebook .
Export to PDF.
Performance improvements:
Make baseline removal much faster by using Eigen3 library (optional dependency).
:
Set mousemode to selection when leaving the plot ().
plot range field not being updated ().
wrong axis tick type used ().
Internal:
Switch from C++11 to C++17.
Reduce code duplication caused by multiple plot types ().
update included QXlsx to 1.4.6.
Log skipped tests.
2.10.126 Jul 2023 15:46
major bugfix:
: Support markdown library discount version 3. Improve Vector BLF dependency (git download must be enabled if needed). Correctly use system header of system QXlsx (). group separator problem in formulas (). Improve log scales (auto scaling and tick number). Improve auto scale (). limits when changing scale (). Use system liborigin headers if linking against system liborigin (). Don't clear the undo history when saving the project (). Properly react on orientation changes in the worksheet properties explorer. In the collections of example projects, color maps and data sets allow also to search for sub-strings and do the search case-insensitive. Properly save and load the property "visible" for box and bar plots in the project file. copy paste and duplication of box and bar plots. .xlsx import: crash importing empty cells. support datetime import (). Properly set the initial properties of the reference line like line width, etc. (). Properly show the initial value of the property "visible" for the reference range (). React of Delete and Backspace keys to delete selected cells in spreadsheet columns (). Update the plot legend on column name changes used in box and bar plots (). the positioning of values labels for horizontal bar plots (). Initialize the parameters for the baseline subtraction with reasonable values on first startup and better apperance of the preview plot ().
| 